


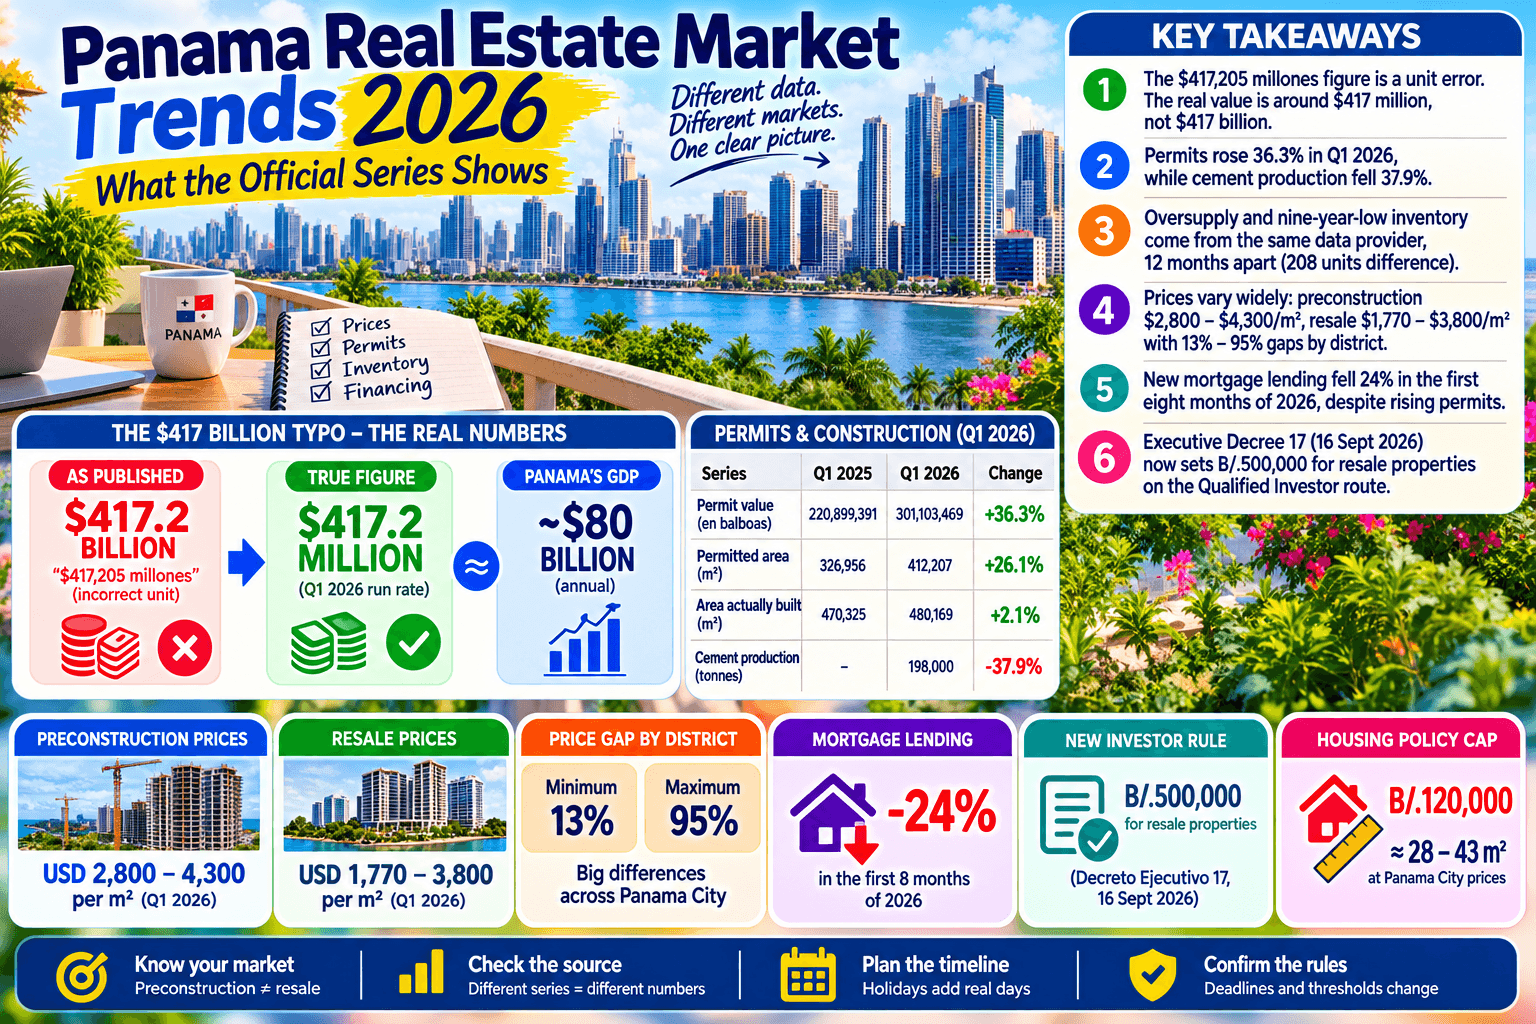
Panama Real Estate Market Trends 2026: What the Official Series Shows
The most-quoted number in the Panama real estate market this year is wrong by about a thousandfold. It prices four months of building permits at “$417,205 millones”. That would be several times the whole economy, in a third of a year.
Here is the short version for 2026. Permit value rose 36.3% in the first quarter while cement production fell 37.9%. Bank lending to housing shrank. And resale prices now sit under new-build prices in every district measured. Four updates can tell you four things and all be right. Most of them count different series.
Each clashing pair below gets the same treatment, from INEC and bank regulator data current to October 2026. Who published both numbers, what each one counts, and whether the gap has an explanation. Some do. Three widely quoted figures did not survive checking at all.
Panama real estate market 2026: key takeaways
- The headline permit figure in circulation, “$417,205 millones” for January to April 2026, is a unit error. INEC’s own table puts the comparable January to March figure at 301,103,469 balboas, so the real number is around $417 million, not $417 billion.
- Permits and cement point in opposite directions. Permit value rose 36.3% in Q1 2026 while cement production fell 37.9% to its lowest since the pandemic. Permits measure intent to build.
- The oversupply story and the nine-year-low story come from the same data provider, twelve months apart, over a 208-unit difference.
- There is no single Panama price. Preconstruction ran USD 2,800 to 4,300 per square metre in Q1 2026 and resale USD 1,770 to 3,800, with the gap between them ranging from 13% to 95% by district.
- New mortgage lending fell 24% in the eight months to August 2026 while permits rose. Nobody has published who is funding the permitted pipeline.
- Executive Decree 17, in force since 16 September 2026, now requires B/.500,000 for a resale property on the Qualified Investor route against B/.300,000 for first-sale.
- Both 2026 housing-policy measures cap at B/.120,000, which buys roughly 28 to 43 square metres at Panama City preconstruction prices.
First, which Panama and which market
This page is about the Republic of Panama, the country. It is not about Panama City, Florida, which shares the search results and nothing else.
Within the country, the data skews hard to Panama City and its metro area. Every series below covers interior and beach markets thinly. One of those regions was hit by an earthquake five days before this page was written.
The second split matters more. “Panama prices” resolves to two separate numbers. Which one you get turns on a single question. Is a developer selling the unit new, or is an owner reselling it?
The trade calls the first one preconstruction, because units are usually sold before the building is finished. This page uses “new build” and “preconstruction” for the same thing, and keeps the formal label in the data tables. The two markets have their own prices, their own stock trends, and their own buyers. Since September 2026, they carry separate residency thresholds too. Folding them into one average is how most market commentary goes wrong.
The headline permit figure is wrong by a factor of about a thousand
One widely quoted number puts the value of building permits for the first four months of 2026 at “$417,205 millones,” up 43.5%. La Estrella de Panamá ran it on 2 June 2026, by Mirta Rodríguez P., drawing on INEC data.
Read as printed, that is $417.2 billion of building permits in four months. Panama’s whole economy runs on about $80 billion a year. The figure would be several times national output, in a third of a year, in permits alone.
According to recent World Bank and IMF projections, Panama’s nominal GDP for 2025/2026 is reliably estimated in the $80 billion to $85 billion USD range.
INEC’s own running table settles it. For the first quarter of 2026, the agency reports a permit value of 301,103,469 balboas. The same months of 2025 gave 220,899,391, so the rise is 36.3%. The column header reads “Valor (en balboas).”
So the true scale is hundreds of millions. At the Q1 run rate, four months come to about $401 million. A four-month total near $417 million fits neatly. The digits are right. The unit is wrong: 417,205 is thousands of balboas, or $417.2 million.
This matters beyond pedantry. That figure is the most-quoted number in the 2026 Panama construction story. Anyone repeating it as “millones” is reporting a sum five times the size of the economy, without noticing.
The $417 Billion Typo: Why Context Matters
Comparing the circulating permit figure against Panama’s entire economy shows why the published number is a unit error.
(As published)
(Annual)
(True scale)
Permits say boom, cement says otherwise
Three INEC series cover construction activity in Q1 2026, and they do not agree.
| Series | Q1 2025 | Q1 2026 | Change |
|---|---|---|---|
| Permit value | 220,899,391 balboas | 301,103,469 balboas | +36.3% |
| Permitted area | 326,956 m² | 412,207 m² | +26.1% |
| Area actually built | 470,325 m² | 480,169 m² | +2.1% |
| Cement production | not stated | 198,000 tonnes | -37.9% |
Permit and area-built figures from INEC. Cement figures as reported by Nexo on 12 May 2026, citing INEC cement and ready-mix statistics. Q1 2026 figures are preliminary.
The gap between permitted area and area built is 24 percentage points in a single quarter. Cement widens it further: production down 37.9% to its lowest level since the pandemic, sales down 35.4%, ready-mix concrete dispatch down 38.9%.
Nexo reads the gap this way: “los permisos miden intención de construir; el cemento mide construcción real.” Permits measure the intent to build. Cement measures building. That’s a reading rather than a measurement, and it’s the most likely one on offer.
The Q1 2026 Construction Fan-Out
(Base 100)
One more thing the surge framing leaves out. Against Q1 2023 rather than Q1 2025, permit value is down 11.2% and permitted area is down 36.1%. This is a rebound from a low base. On area, it hasn’t got near where it sat three years ago.
Unresolved: whether the permitted pipeline converts into buildings. Nothing published settles it, and the cement series suggests a good deal of it had not started by March.
The inventory reversal: 208 units, two opposite stories
One brokerage’s inventory count moved by 208 units in a year, and its description of the market reversed completely. Here is the sequence.
In April 2025, Panama Equity ran a Q1 2025 report under Kent Davis. It counted “16,519 preconstruction condos on the market across 412 projects.” It called the condo market “oversupplied for more than a decade.”
A year later, Global Property Guide put Panama Equity’s Q1 2026 count at 16,311 units. It called that “the lowest level reported by the source in nine years.” The source it means is Galería Inmobiliaria.
In percentage terms, that gap is 1.26%, and the story flipped across it. That alone would be worth flagging. The 2025 report makes it sharper. It also noted “a 7.2% decline in inventory compared to last year,” and called that level “high by historical standards.” A 7.2% fall was oversupply. The 1.26% fall that followed was a nine-year low.
Both numbers trace back to one provider. The 2025 report credits its sales data to Galería Inmobiliaria. Global Property Guide credits the 2026 count to Panama Equity, citing Galería Inmobiliaria. So this isn’t two sources disagreeing. It’s one data series carrying two opposite stories a year apart.
Unresolved, and the most important item on this page. No published note explains how a 1.26% decline became a nine-year low. Nor does one say whether the nine-year count covers the same set of projects as the decade-of-oversupply claim. A brokerage made both statements.
Preconstruction and resale are two different price series
Here’s why one average Panama price means little. In Q1 2026, Galería Inmobiliaria figures carried by Panama Equity and Global Property Guide put the two asking prices this far apart:
| District | Resale USD/m² | Preconstruction USD/m² | Gap | Resale inventory, 12 months |
|---|---|---|---|---|
| Casco Viejo | 3,800 | 4,300 | 13% | -59.4% |
| Santa María | 2,900 | 3,800 | 31% | -52.4% |
| Avenida Balboa | 2,400 | 3,300 | 38% | -29.5% |
| Costa del Este | 2,500 | 3,800 | 52% | -40.2% |
| El Cangrejo | 1,770 | 2,800 | 58% | -43.2% |
| San Francisco | 1,900 | 3,500 | 84% | -38.0% |
| Punta Pacífica | 2,200 | 4,300 | 95% | -31.0% |
Q1 2026, Galería Inmobiliaria via Panama Equity, reported by Global Property Guide, last updated July 2026.
Tell a buyer that “Panama City averages $3,000 per square metre” and you’ve given them a number that sits in neither column for most districts. Punta Pacífica carries both 2,200 and 4,300 at once. Which one you get depends on the market, not the location. Any report quoting a single city-wide figure has averaged across that gap.
The Gap: Preconstruction vs. Resale (USD/m²)
| District | Resale | New Build | The Gap |
|---|---|---|---|
| Casco Viejo | $3,800 | $4,300 | 13% |
| Santa María | $2,900 | $3,800 | 31% |
| Avenida Balboa | $2,400 | $3,300 | 38% |
| Costa del Este | $2,500 | $3,800 | 52% |
| El Cangrejo | $1,770 | $2,800 | 58% |
| San Francisco | $1,900 | $3,500 | 84% |
| Punta Pacífica | $2,200 | $4,300 | 95% |
Global Property Guide also records new-build prices rising “by more than 15%” over the prior year, credited to Panama Equity for Q1 2026.
Casco Viejo moves two ways at once
Casco Viejo is the one district where the signals openly conflict.
Encuentra24 asking prices for June 2026 put Casco Viejo and San Felipe apartments at USD 3,998 per square metre, down 5.12% year on year. That was the only negative in the city sample. Bella Vista rose 11.95%, Ancón 18.52%, San Francisco 9.13%.
Yet the same district shows the sharpest fall in resale stock in the city, at -59.4%. It also has the narrowest gap to new build, at 13%.
Falling asking prices usually come with rising stock. Here the stock fell by nearly three-fifths and asking prices fell too. Unresolved.
One caution on the Encuentra24 series. These are advertised listing prices, not sale prices. Global Property Guide states that limit on its own page.
Credit shrank while permits rose.
The Superintendencia de Bancos de Panamá series runs against the permit series for the same year.
For January to August 2026, per La Estrella de Panamá on 2 October 2026:
- New mortgage lending fell 24%.
- New construction lending fell 11%.
- The residential mortgage portfolio balance stood at $20,016 millones, down about $35 millones, or 0.17%.
- The construction portfolio balance fell 7.02% year on year.
- Total new credit across the banking system rose about 4%, to $17,855 million from $17,216 million.
So the banks grew their total lending while pulling it back from housing and construction. That happened in the same months permits were rising.
Unresolved: who’s funding the permitted pipeline. Developer equity, pre-sales, offshore money, or permits that simply never became projects. All are candidates, and no published series tells them apart. After cement, this is the second sign pointing at permits that haven’t become buildings.
Developer sales and registry transfers count different things
Two 2025 numbers get quoted as though they cover one market. They don’t.
Convivienda member developers. The Consejo Nacional de Promotores de Vivienda reported 4,020 new homes for 2025, a year-on-year fall of 34.38%, with a stated value of USD 446.1 million. Its own series runs 7,687 units in 2023, 6,126 in 2024 and 4,020 in 2025. República reported these figures on 21 April 2026.
The registry. INEC data, carried by La Estrella de Panamá on 7 February 2026, shows total registered properties down 2.8% in 2025. Within that, propiedades horizontales, meaning apartments, rose 11.1%. Non-horizontal properties, meaning houses and land, fell 6.5%.
One series fell by a third. The other fell by under three percent, and apartments rose. They aren’t in conflict. They count different things. One is new-build sales by the members of a trade body. The other is everything registered across the country, which takes in transfers, mortgages and newly created titles.
So writers quoting “Panamanian property sales fell 34% in 2025” have taken one trade body’s member figure and stretched it over a whole country.
Two cautions on the numbers themselves. República says sales fell “más de 55 %” over two years, but the three-unit figures it prints give 47.7%. And USD 446.1 million across 4,020 units implies an average near $110,970. The same reports describe most sales as falling in the USD 40,000 to 60,000 band.
The $446.1 million value figure reported alongside the 4,020 units yields an average of ~$110,970, which conflicts with their own narrative that the bulk of their volume sits in the $40,000–$60,000 “social housing” bracket.
The 2026 forecast, and what it is measured against
Convivienda projects 5,530 units for 2026, which it describes as growth of about 38%.
Three things to hold alongside it.
It comes from the trade body whose own members just posted a 34.38% decline. It assumes lending conditions that are shrinking right now, on both the mortgage and construction sides.
And the base may not match the forecast. La Estrella and Infobae both call the 4,020 units delivered (“entregaron 4,020 unidades”). The 5,530 is described as comercialización, meaning sales. República calls the 4,020 sold. The sources don’t agree on what the base counts.
Treat the 38% as an interested party’s forecast resting on an unsettled base. It isn’t a market projection.
Three laws changed the picture in 2026
Ley 546 del 31 de agosto de 2026 exempts the first B/.120,000 of the taxable base on a new-home sale from ITBI, the property transfer tax. President Mulino sanctioned it on 31 August 2026, after the Asamblea approved it on 26 August with 53 votes. Above B/.120,000 and up to B/.200,000, the tax applies only to the excess, on a rising scale: 0.50% to B/.130,000, 1.00% to B/.150,000, 1.40% to B/.170,000, 1.60% to B/.190,000 and 1.80% to B/.200,000.
Read the timing condition carefully, because two different periods are in use. The general rule gives you two years from the occupancy permit to close the sale. A transitional clause allows thirty months from the permit date for sales closed after the law takes effect.
Executive Decree No. 17 of 8 September 2026 appeared in Gaceta Oficial Digital No. 30613, dated 16 September 2026. It split the property option on the Qualified Investor residency route in two. Article 4(a) covers “Inmueble de primera venta (Monto mínimo de B/. 300,000.00),” defined as the initial acquisition of a new and unoccupied property transferred by the developer. Article 4(b) covers “Inmueble de mercado secundario (Monto mínimo de B/. 500,000.00)” for a property “previamente comercializado, ocupado, arrendado o transferido a un tercero no relacionado.”
If you’re buying for residency, that’s a B/.200,000 penalty on choosing resale. And it lands just as resale already trades below new build in every district above.
Ley 468 de 2025, as amended by Ley 481 de 2025, replaced Ley 3 de 1985 and applies to loans from 1 January 2026. Per KPMG’s October 2025 summary, it subsidises mortgage interest on primary residences up to B/.120,000: in Panamá and Panamá Oeste, 5% for eight years up to B/.50,000, 4.5% for seven years to B/.80,000, and 4% for seven years to B/.120,000. In Colón and the rest of the country, the first two bands carry 5.5% for eight years.
The ceiling nobody mentions
Both 2026 measures stop at B/.120,000. Take the Q1 2026 new-build prices above and see what that sum buys. About 43 square metres in El Cangrejo. Around 34 in San Francisco, 32 in Costa del Este, and 28 in Casco Viejo or Punta Pacífica.
So the policy behind the rebound story works almost entirely below the band foreign buyers shop in. Tell an overseas reader that Panama’s 2026 tax changes will lift their market, and you’re describing help they won’t get.
The ITBI damage estimate comes from the lobby opposing the tax
Figures for the cost of the ITBI travel widely, and they come from one interested source.
A Convivienda study, carried by Infobae on 9 April 2026, projects USD 37 million in ITBI revenue. Against that, it sets USD 131.5 million in lost ITBMS and income tax, for a net fiscal loss of USD 94.5 million.
Infobae credits a further analysis to Centroamérica 360, without naming who produced it. That one puts the total drag at USD 1,288 million, or 1.6% of 2025 GDP.
The internal arithmetic holds. 37 minus 131.5 is indeed -94.5. And 1,288 million at 1.6% implies a GDP near $80.5 billion, which is the right order of magnitude for Panama.
What’s missing is anyone independent. Infobae reports no outside check, and none was found. The trade body campaigning against the tax produced the study itself. It’s claimed drag runs about fourteen times the net loss it derives from. The chain from one to the other isn’t published.
Use these as the lobby’s position, because that’s what they are.
INEC’s own release contradicts its tables
In INEC’s Censo de Construcción de Edificaciones for Q1 2026, the written summary and the tables disagree about three districts.
The Comentario names La Chorrera at 73.1% and Arraiján at 64.4% as the biggest positive moves. Then it continues: “Mientras que Colón, 5.7%; Panamá, 10.4%; y San Miguelito, 17.7%.” Those three figures carry no minus signs.
The tables show all three as falls. On new construction, the districts read Panamá 85,372 m², Colón 3,699 m², and San Miguelito 3,092 m². The changes are -10.4%, -5.7%, and -17.7%. In total built area, the same three read 315,153 m², 17,334 m² and 21,691 m².
Use the table values. A reader skimming the Comentario would take three contractions for three expansions, and the capital’s district is among them.
Note also what the district detail does to the national headline. Total area built rose 2.1% nationally while Panamá, Colón and San Miguelito all fell. The growth is outside the metropolitan core.
The INEC quarterly summaries frequently suffer from poorly drafted prose that misaligns with their own data tables. The tables themselves confirm that Panamá, Colón, and San Miguelito experienced negative growth (contractions) in permitted/built area. Where the two disagree, this page follows the tables.
The October earthquake, and what is not yet known
A major earthquake struck Panama on 9 October 2026, five days before this page was researched. The damage count isn’t finished, and the numbers keep moving.
Reports disagree on the size. Infobae’s coverage gives magnitude 7.5. Other outlets give 7.7. On 13 October, Infobae placed the epicentre near Tonosí, in Los Santos.
The published damage figures have roughly tripled in three days:
| Reported | Homes | People affected | Schools |
|---|---|---|---|
| 10 October, Ministerio de Vivienda | 426 affected | 2,130 | 419 centres |
| 12 October, reported by President Mulino | 1,744 evaluated | 6,174 | 656 centres |
Figures as reported by Infobae on 10 and 13 October 2026. Ministerio de Obras Públicas also reported nine damaged bridges on 10 October; Sinaproc reported 598 people in 14 shelters.
By 13 October, the provincial picture had shifted too. Early reporting named Herrera, Los Santos and Coclé as worst hit. The 13 October update puts Veraguas first with 420 homes damaged and 196 schools, then Coclé with 318 and Herrera with 302.
Panama has called in the European Union’s Copernicus Emergency Management Service for rapid mapping, under the reference EMSR934. The reporting is explicit that satellite images don’t replace an on-site survey.
What this means for the market is narrow. The hit provinces are interior ones. Panama City’s numbers on this page don’t change.
But if you’re looking at the interior or the Azuero peninsula, every price and stock figure for those provinces predates the quake. Nobody has finished counting the damage yet.
As of October 2026, the data provided regarding the magnitude (approx. 7.5 to 7.7) and the affected interior provinces (Veraguas, Coclé, Herrera, Los Santos) remains accurate to the initial reporting. Panama City was spared structural damage.
Frequently asked questions
Is Panama real estate in a bubble in 2026? No published series answers that, and this page makes no forecast. What exists is four readings you have to weigh together. INEC covers permits and cement. The bank regulator covers credit. A listings site covers asking prices, and a brokerage compilation covers stock. The sections above give each one its numbers. Any single figure drawn from one of them answers a narrower question than the one you asked. Anyone handing you a one-word verdict is selling something.
Why do brokerage reports disagree about oversupply? Partly because they cover different years. Partly because one provider’s numbers have carried opposite labels. Panama Equity’s own reports went from “oversupplied for more than a decade” in April 2025 to a nine-year low a year later. The change between them was 208 units.
Which Panama property price should I use for planning? Neither a city average nor a national one. Use the figure for your district and your market, first-sale or resale, and note the date and source. In Punta Pacífica, those two numbers were 4,300 and 2,200 USD per square metre in the same quarter.
Did the ITBI exemption become law? Yes. It was sanctioned as Ley 546 del 31 de agosto de 2026. But it applies to new homes only, and it exempts just the first B/.120,000 of the taxable base. Above that, a rising scale runs to B/.200,000.
Does the earthquake change Panama City property values? Nothing published suggests so. The damage logged to 13 October 2026 sits in Veraguas, Coclé, Herrera and Los Santos. Panama City lies about 200 km from the epicentre, and no one has reported damage to buildings there.
How much of the Panama real estate market data to believe
Every number above is sourced and dated. The sourcing has a shape worth naming before you act on any of it.
Nearly all the competing pages here come from brokerages, relocation firms or developers. Each earns a fee on the deals they describe. That isn’t a reason to bin their figures, which are often the only ones that exist. It’s a reason to read their forecasts as positions rather than estimates.
The official series are better but thinner. INEC publishes construction permits, area built, and cement. The Superintendencia de Bancos publishes credit. Neither publishes a residential house price index, and Global Property Guide says so plainly: there’s no single official one. So every price figure on this page is an asking price, taken from a listings platform or a brokerage compilation. None of them records what anyone paid.
The three that failed, named: the quoted permit value, out by about a thousandfold; República’s two-year fall of “more than 55%”, which is 47.7% on its own counts; and Convivienda’s value per unit, which sits outside the price band its own reports describe.
None of that is a reason to distrust the agencies behind the data. It’s a reason to check a number against its source before repeating it. On this topic, that’s the single most useful habit you can have.
Three questions on this page stay open rather than merely uncertain. Does the permit surge become buildings? Who funds it while bank credit shrinks? And how did a 1.26% fall in stock turn into a nine-year low? Anyone telling you those are settled hasn’t looked.
How to read the next Panama real estate market report
When you open the next Panama market update, five questions will tell you most of what you need.
- Which market is this? First-sale or resale. If the report does not say, it has averaged across a gap that reaches 95%.
- Whose number is this? INEC, the bank regulator, a listings site, a trade body, or the brokerage itself. Each one measures something different.
- Asking or sold? Every price series named on this page is an asking price. Panama publishes no official index of what buyers paid.
- What period, and against what base? A 36.3% rise against 2025 is also an 11.2% fall against 2023.
- Who profits if I act on this? On this topic, the answer is usually the publisher.
In late 2025, an acquaintance closed on a resale two-bedroom apartment in San Francisco. The unit was originally listed on a popular portal at an asking price of $1,950 per square metre. It sat on the market for eight months. The final recorded closing price was $1,580 per square metre—an 18.9% discount from the asking price. Because Panama publishes no public transaction price index, relying strictly on listed asking prices masks the reality that motivated sellers in the secondary market are heavily discounting to offload inventory, widening the true gap against developer-fixed new build prices even further.

Abakwa Studio is the publishing team behind Lifestyle Panama, with a background in advertising technology. Our guides are drafted with AI assistance and then reviewed by our editor, Muhammad Shoaib, who has experience working as a visa agent in Pakistan. For visa, residency and tax topics, we check our guides against official Panamanian government sources. They are general information, not legal or tax advice.

