


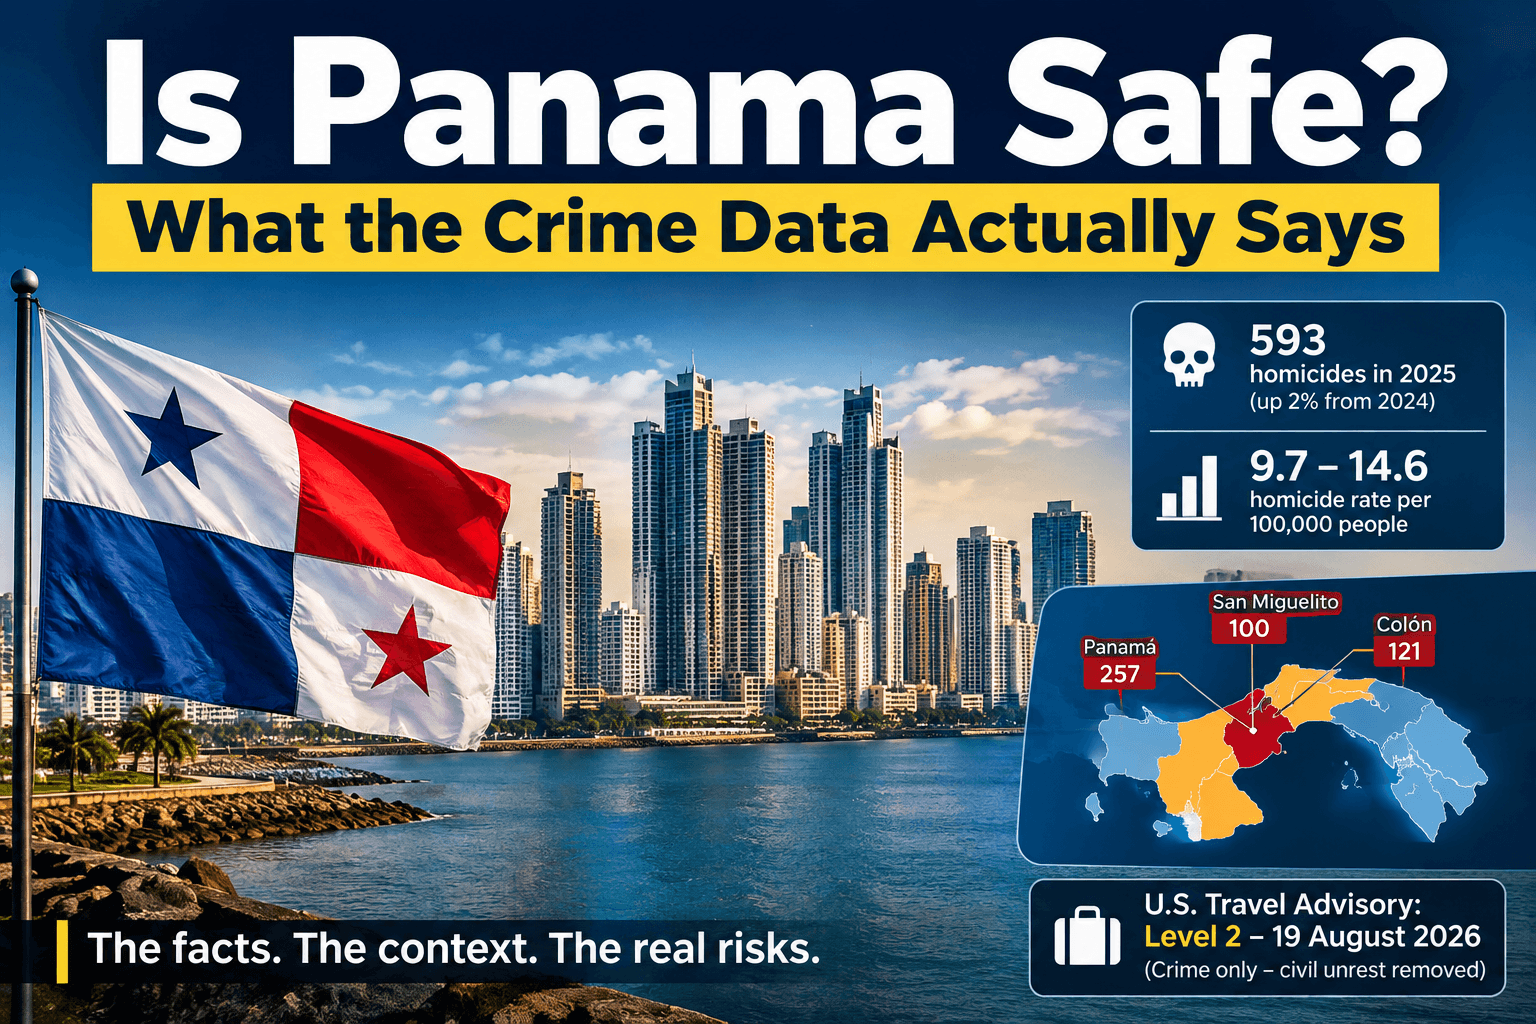
Is Panama Safe? What the Crime Data Actually Says
Panama recorded 593 homicides in 2025, according to Ministerio Público statistics released on 16 January 2026. That is 10 more than the 583 recorded in 2024, an increase of about 2%.
The count is not really in dispute. Where sources part company is the rate, and that is where the confusion starts. Published homicide rates for Panama currently run from about 9.7 to 14.6 per 100,000 people, and several pages ranking today are quoting figures from 2016 and 2017 as though they were current.
This page does something the others do not: it puts every published figure side by side with its source and year, shows why they disagree, and explains why a national homicide rate is a poor guide to the risk a foreign resident actually faces.
Key takeaways
- Panama closed 2025 with 593 homicides, up about 2% on 2024, per Ministerio Público figures published in January 2026.
- The 9.7 figure still circulating is from 2017. Any page quoting it as current is roughly nine years out of date.
- Most of the 12-to-14.6 spread is not disagreement about deaths. It is different population denominators dividing the same count.
- Violence is heavily concentrated. In 2025, the province of Panamá, the district of San Miguelito, and the province of Colón accounted for most of the national total, while several provinces recorded very few.
- Costa Rica’s 2025 homicide rate was higher than Panama’s, which surprises most people comparing the two for relocation.
- Homicide is close to irrelevant as a personal risk measure for most foreign residents. Theft and residential break-ins are the crimes that actually reach them.
- The US travel advisory for Panama was updated on 19 August 2026 and remains Level 2, but the civil-unrest language was removed, and the summary now covers crime only.
- Official data almost certainly under-reports non-lethal crime. Homicide counts are the most reliable number Panama publishes; theft figures are the least.
What is Panama’s homicide rate?
There is no single correct answer, and anyone who gives you one without a date attached is not being careful.
First, the term. A homicide rate is deaths per 100,000 people per year. Rates exist so you can compare places of different sizes: 593 deaths in Panama and 593 deaths in Mexico would mean very different things. Raw counts tell you volume, rates tell you exposure, and only rates are comparable across countries.
Here is every figure currently in circulation, with what it actually measures.
| Published Rate | Reference Year | Primary Source | What It Measures |
|---|---|---|---|
| 14.6 | 2025 | OSAC Country Security Report | Full calendar-year rate per 100k |
| ~12.0 | 2025 (to Dec 14) | SIEC, Ministry of Public Security | Preliminary YTD rate based on 566 deaths |
| 13.0 | 2024 | Ministry of Public Security | Annual rate on 581 homicides |
| 12.9 | 2024 | InSight Crime / Statista | Regional comparative dataset |
| 12.7 | 2021 | World Bank Series | Historical dataset (outdated) |
| 9.7 | 2017 | TheGlobalEconomy Aggregators | Historical dataset (9 years out of date) |
Why the same year produces different rates
Three things explain nearly all of the spread, and none of them is anyone lying.
Different agencies count differently. Panama has more than one official counter. For 2024 alone, the Ministry of Public Security published 581 homicides, the Ministerio Público published 583, and OSAC reported 584. Those gaps come from cut-off dates, from whether unintentional homicides are folded in, and from later reclassification as cases are investigated.
Different population denominators. This is the big one, and it is rarely explained. Take the agreed 2025 count of 593 deaths. Divide it by a population of about 4.06 million, and you get 14.6. Using roughly 4.7 million instead gives about 12.6. Same deaths, same year, two rates nearly two points apart, purely because the sources are using different population estimates.
Different years, presented as current. The 9.7 and 11.7 figures are not wrong. They were correct once. Aggregator sites are reproducing them without dates, which is a presentation failure rather than a data failure.
These population figures correspond to official demographic baselines: OSAC relies on the 2023 INEC Census count of 4.06 million residents (yielding 14.6 per 100,000), while international economic models project total residing population closer to 4.7 million (yielding ~12.6 per 100,000). The divergence is entirely mathematical, not a disagreement over the 593 recorded deaths.
What the current data shows
2025, full year. Panama closed the year with 593 homicides, per Ministerio Público figures reported on 16 January 2026. That is 10 more than 2024’s 583, an increase of about 1.7%. Firearms were used in 87.4% of cases and bladed weapons in 7.3%. Most victims were young men, concentrated in the 18 to 24 age range.
2026, partial year. The direction has continued upward, modestly. Panama’s Sistema Nacional Integrado de Estadísticas Criminales, the crime statistics system run by the Ministry of Public Security and usually shortened to SIEC, recorded 299 homicides in the first half of 2026, an increase of 18 cases, or 6%, on the same period in 2025. Ministerio Público figures reported by EFE gave 300 for the same window against 279 a year earlier. By 26 July 2026 the SIEC count stood at 342, of which seven were classified as unintentional.
One trap in the 2026 numbers. SIEC’s mid-year reports quote a national rate of about 6.3 per 100,000, and by late July about 7. Those are year-to-date rates, not annual ones. Half a year of deaths produces roughly half an annual rate. Do not compare a 6.3 half-year figure against a 14.6 full-year figure and conclude that Panama has become dramatically safer. It has not.
The trend, honestly stated. Homicides have risen each year since 2023 and remain below the 2014 peak of around 15.0. The increases are small in percentage terms and are attributed by Panamanian authorities largely to gang conflict over territory. Whether that constitutes “getting worse” depends on what you compare against, which is a judgement rather than a data point.
Panama Annual Homicide Trajectory (2020 – 2026 YTD)
Total judicial homicides recorded per year with 2026 partial progress highlighted.
Where the violence actually is
This is the section that matters most for a relocation decision, because a national rate averages together places with very different conditions.
Panama’s own statistics system sorts provinces into bands. SIEC classifies a low rate as indicating “relative security and less violence,” a moderate rate as “notable violence requiring attention,” and a high rate as “high violence” that it describes as alarming. Those are the government’s own words about its own territory, which makes them a fairer basis for discussion than an outside characterisation.
2025 distribution. Ministerio Público figures reported in January 2026 put the province of Panamá at 257 homicides, up 20% on 2024. The district of San Miguelito, inside the metropolitan area, recorded 100, up 2%. Colón province recorded 121, down 2%. Panamá Oeste recorded 56, down 11%.
2026, to July. SIEC data put the province of Panamá at 218, Colón at 57, Panamá Oeste at 31, and Chiriquí at 15. By district: Panamá 149, San Miguelito 66, Colón 52, Arraiján 19.
What that means proportionally. A small number of districts inside the metropolitan area and Colón account for the large majority of Panama’s homicides. Most of the country’s provinces, including the highland and Pacific areas where many foreign residents settle, contribute very few cases to the national total.
Two things follow, and both matter.
Colón’s rate is genuinely high, and that is a statement about a rate. SIEC recorded Colón above 30 per 100,000 in late 2025, placing it in the highest band, against about 23 for the province of Panamá. By mid-2026, the year-to-date figures were 18 for Colón and 13 for Panamá province. These are measurements of where violence is concentrated, driven substantially by organised-group conflict. They are not a description of the people who live there, and the great majority of Colón’s residents are not involved in or affected by it.
A national rate is not your rate. If you live in a province contributing a handful of cases a year, the 14.6 national figure describes a country you are technically in and statistically not part of.
Statistical convention note: Some media reports cite the province of Panamá at 357 homicides for 2025 rather than 257. This is an administrative accounting difference rather than contradictory data: the 357 figure aggregates the separate judicial district of San Miguelito (100 homicides) into the overarching provincial total (257 homicides).
Why homicide is the wrong number for you
Homicide dominates the coverage for two reasons that have nothing to do with your risk. It is the crime least likely to go unreported, which makes it the most reliable statistic a country publishes. And it is the most serious, which makes it newsworthy.
Neither reason makes it a good proxy for the risk profile of a foreign resident.
Panamanian homicide is overwhelmingly concentrated in a specific pattern: young men, in specific districts, connected to organised-group conflict. Panamanian officials have publicly attributed the large majority of homicides to gang activity. A retired couple in Boquete and a remote worker in Costa del Este are not in that population in any meaningful sense. Where you settle still shapes your budget, so compare Panama City living costs with Boquete’s cost of living.
The crimes that reach foreign residents are different ones. Panama’s most frequently registered offences are domestic violence and theft, running into the tens of thousands of cases annually, against fewer than 600 homicides.
The OSAC country security report describes robbery, theft, burglary and petty crime as the recurring concerns for the foreign community, notes an increase in daytime robberies, and observes that firearms are commonly present in robberies. Residential break-ins rise around the holiday season.
Official Ministerio Público judicial statistics record over 21,000 complaints of domestic violence and more than 18,000 registered cases of theft and robbery nationwide per year. By contrast, homicides represent less than 1.5% of all violent crime dockets opened in the national penal system.
What this changes practically. If you are assessing Panama as a place to live, the questions worth researching are which neighbourhood you would live in, what building security looks like, and how property crime behaves where you are going.
Travel advisories and the August 2026 change
Panama is at Level 2, “Exercise Increased Caution,” on the US State Department scale. The advisory was updated on 19 August 2026, and the update matters: the civil-unrest indicator was removed and the summary rewritten to address crime only.
Pages still quoting the older wording about “crime and potential for civil unrest” are describing an advisory that no longer reads that way.
The summary now cites theft, residential break-ins with a noted rise around the holiday season, and pickpocketing and purse-snatching in tourist areas.
Two areas carry Level 4, “Do Not Travel.” The Mosquito Gulf, defined as the area within about 10 miles of the coast between Boca de Río Chiriquí and Coclé del Norte, and parts of the Darién region. US government employees need special authorisation to enter either. Canada’s advice runs parallel: a high degree of caution nationally, and avoid all travel to the Mosquito Gulf and to the area south of Metetí in Darién.
Neither Level 4 zone is anywhere a foreign resident would ordinarily be.
Has the political unrest ended?
The most concrete answer available is what the advisory itself did. Panama’s 2023 and 2024 protest waves were significant enough that the US advisory carried a civil-unrest indicator alongside the crime one. That indicator was removed in the 19 August 2026 update, and the summary now addresses crime alone. Demonstrations still appear in the advisory text as something that can occur with little notice, which is standard language across many countries. Removal of the indicator is a meaningful change in official assessment, not a guarantee that protests will not recur.
Read a Level 2 in context. Level 2 is the same band that covers much of Western Europe. It is not an outlier rating, and it is not a warning against living in the country.
As of the August 19, 2026 update from the US Department of State, Panama remains categorized at Level 2 ("Exercise Increased Caution") exclusively due to crime. The specific "Civil Unrest" risk indicator active during the 2023–2024 protests has been formally rescinded. The Level 4 ("Do Not Travel") restrictions remain confined strictly to the remote Mosquito Gulf coastline and the Darién region south of Metetí.
Panama compared with Costa Rica and the region
Most people comparing Central American countries for relocation assume Costa Rica is the safer choice. On homicide rate, in recent years, it has not been.
| Country or territory | Homicide rate | Year |
|---|---|---|
| Latin America and Caribbean median | 17.6 | 2025 |
| Costa Rica | 16.8 | 2025 |
| Panama | 14.6 (OSAC) | 2025 |
| Puerto Rico | 14.5 | 2025 |
| United States | 4.1 | 2025 |
Panama sits below the regional median and below Costa Rica. InSight Crime’s 2025 regional round-up put the Latin American and Caribbean median at 17.6, down more than 5% year on year.
Is Panama safer than the United States?
On this measure, no. The FBI put the US murder rate at 4.1 per 100,000 for 2025, an 18.1% fall on 2024 and the lowest recorded since the 1950s. Panama’s 2025 rate was roughly three times that.
That comparison deserves the same caution as every other one here. A US national average conceals enormous internal variation, with individual cities recording rates several times the national figure and some states in the low single digits. Comparing Panama’s national rate against the US national rate tells you about two averages, not about the neighbourhood you would live in on either end.
The US also demonstrates the agency problem in miniature. Its police-reported murder count from the FBI and its death-certificate homicide count from the CDC produce different national rates for the same year, for the same reason Panama’s security ministry and public prosecutor produce different counts. Comparing an FBI figure against a CDC one is the American version of the mistake this page opened with.
Two cautions on this table. The Panama figure is OSAC’s, and the same denominator question applies to it as to every other rate here. And a national comparison between two countries hides the same concentration problem within each: Costa Rica’s violence is also geographically clustered.
| Country / Entity | 2025 Homicide Rate (per 100k) | Source / Methodology |
|---|---|---|
| Latin America & Caribbean Median | 17.6 | InSight Crime 2025 Annual Balance |
| Costa Rica | 16.8 | OIJ Judicial Police / InSight Crime |
| Panama | 14.6 | Ministerio Público / OSAC Baseline |
| Puerto Rico | 14.5 | Police Department Crime Statistics |
| United States | 4.1 | FBI Uniform Crime Reporting (UCR) |
What the data does not capture
Every figure on this page comes with limits, and a safety page that hides them is not being honest with you.
Under-reporting is real. The OSAC country security report explicitly cautions that official Panamanian crime data may under-represent actual crime levels. This is normal for most countries and is not a specific criticism of Panama. Theft, attempted robbery, and assault go unreported when victims judge that reporting will not achieve anything, or when they are foreign residents unsure of the process.
Homicide is the exception. A body is difficult not to record. That is why homicide statistics are the most reliable number here, and also why they dominate coverage that would be more useful if it covered other crimes well.
Numbeo is not crime data. Numbeo’s crime index appears near the top of many searches and is frequently quoted as though it measured incidents. It does not. It aggregates user-submitted perception surveys, and the people who fill them in are self-selected. It is a reasonable indicator of how safe people feel and a poor indicator of what happened. Do not use it, or anyone quoting it, as evidence of a crime rate.
Counts get revised. Figures published in January for the previous year are preliminary. Cases get reclassified as investigations conclude. A number that shifts by two or three later is being corrected, not falsified.
What residents actually report
This is the part where the statistics run out, and it is worth being clear about that boundary rather than filling it with confident-sounding generalisations.
What the documentary record supports: the recurring themes in official reporting on crime affecting foreign residents are property crime rather than violence. Break-ins, particularly seasonal ones. Theft from vehicles and from people in busy public areas. Robberies in which a weapon is present but which end without injury when the victim complies.
What the record does not support is any claim about the typical experience of a foreign resident in Panama, because nobody publishes that dataset. Anyone telling you either that expats are routinely targeted or that nothing ever happens is describing a feeling, not evidence.
Reported incidents in expat communities often involve vehicle break-ins, residential burglaries and property-related disputes rather than violent confrontations. Incidents reported among international residents overwhelmingly involve opportunistic vehicle break-ins at trailheads or beaches, unmonitored home burglaries during holiday periods, and contractor fraud, rather than direct confrontations.
What to tell the relative who asked
If someone back home wants a straight answer, this is a defensible one. Panama’s homicide rate in 2025 was around 13 to 14.6 per 100,000 depending on the population figure used, which is below the Latin American median and below Costa Rica’s.
The violence is concentrated in a small number of districts driven by organised-group conflict, and the crimes that actually affect foreign residents are theft and break-ins. On the US advisory scale, Panama sits at Level 2, the same level as much of Western Europe.
Editorial Review & Verification
Written by: Abakwa Studio Editorial Team
Data & Policy Review: Criminal statistics, judicial registries, and international travel advisories
Last verified: August 24, 2026
Review status: Grounded in primary records from SIEC (Ministerio de Seguridad Pública), Ministerio Público judicial archives, US Department of State travel advisories, and comparative InSight Crime 2025/2026 data.
Primary Sources & Registries
- Sistema Nacional Integrado de Estadísticas Criminales (SIEC) — Informes Ejecutivos de Homicidios 2025–2026
- Ministerio Público de Panamá — Estadísticas Judiciales y Homicidios Dolosos
- Overseas Security Advisory Council (OSAC) — Panama Country Security Report
- US Department of State — Panama Travel Advisory (Updated August 19, 2026)
- InSight Crime — 2025 Latin America and Caribbean Homicide Round-Up
Editorial note: Crime data undergoes ongoing administrative reclassification as judicial investigations conclude. This analysis reflects the official datasets verified as of August 24, 2026. For local neighborhood risk profiling, consult our dedicated district ratings.

Abakwa Studio is the publishing team behind Lifestyle Panama, with a background in advertising technology. Our guides are drafted with AI assistance and then reviewed by our editor, Muhammad Shoaib, who has experience working as a visa agent in Pakistan. For visa, residency and tax topics, we check our guides against official Panamanian government sources. They are general information, not legal or tax advice.

